TCA Transaction Cost Analysis
A few years ago there was a sign in a café where we used to go for morning coffee which said “Buy two croissants, get one for free”. This sounded good, but what in fact it meant was that if two customers each ordered a full breakfast with croissant, including freshly squeezed orange juice (!), they would get an extra croissant (to share between them, I suppose).
This anecdote comes to mind when you're walking through an airport and see a sign saying “NO COMMISSIONS” at the bureau de change. It's often the case that services which purport to be free end up being costly, and foreign exchange is no exception: if you were to stop and look at the buy and sell prices for the US dollar/euro for example, you'd see that the spread (the difference between the buy and the sell price) is close to 30%! These are figures at 11 March in Terminal 4 of Madrid Barajas Airport, USD/EUR 0.92 – 1.24 respectively. That's 3,000 basis points!!. So if a traveller visits the bureau when they're leaving the country and again when they return (exchanging any left-over dollars for euros upon their return) they'll get 30% less back. That said, their receipt will say "Transaction costs = 0”.
This trick of hiding exorbitant implicit costs (opening the spread) with explicit zero or close to zero costs (commissions) can also occur in CFDs (Contract for Difference): some issuers offer buy and sell prices for CFDs which are more open than those of the underlying asset, meaning that the buy price is lower than normal and the sell price higher. They then state that they're offering zero or very low fees to entice investors (quite apart from other appealing features such as leverage).
When trading on the stock exchange, liquidity helps keep spreads at a bare minimum, but this doesn't prevent other “implicit” costs due to various factors: market risk, the impact of our own trades (for orders with high volumes or illiquid securities), etc. Nearly all of these depend on the trader's ability (or the trading system for orders managed by algorithms) to carry out buy orders at the lowest possible price and sell orders at the highest possible price. Given that the final implicit cost of a transaction could double or even treble the commission a broker charges, it is vital to be able to measure the cost to know whether the broker is offering a good service.
This is even more pressing given the large-scale introduction of computer trading over the past 10 years in the financial markets, including, inter alia, algorithmic trading (AT) and High Frequency Trading (HFT). At the same time we've seen liquidity fragmentation, which has forced brokers to disperse their execution in various MTFs to try and honour their Best Execution policies. And to complicate matters even more, regulations have become stricter, forcing members to improve pre- and post-trade transparency.
This means that companies trading in the markets (we're talking about both the buy-side and the sell-side here) have to monitor and measure their trading efficiency against official benchmarks, in other words, they need to quantify this efficiency based on general and imprecise terms such as execution risk (which concerns the price obtained as against the price when the order was received), market impact, spreads and intraday liquidity.
And this is where TCA (Transaction Cost Analysis) systems come in. These applications can objectively consider both implicit and opportunity transaction costs. They can analyse how effective an execution service is, and allow the client to assess their broker, thereby encouraging transparency. And this is precisely why the ESMA opted to include TCAs in its December 2014 Consultation Paper. It is also extremely likely that forthcoming legislation will oblige ISCs (investment service companies) to use this tool to report implicit costs.
TCA also enables traders to set themselves apart and to stand out from their peers, and offers investors new variables so they can decide which managers are going to be in charge of their orders.
TCAs generally use two benchmarks to analyse a specific trade: the first is the price of the security in the market at the time the broker receives the order (known as the Implementation Shortfall) while the second is the VWAP (Volume Weighted Average Price) during the period in which the broker executed the order.
In order to measure the cost using the first method, you just have to calculate the difference in basis points between the average execution price carried out by the broker and the price of the security when the order was received (Arriving Price). Logically, in a buy order the higher the VWAP is compared to the Arriving Price, the worse the execution price will be (for a sell order, it is the other way around).
In the second method, the implicit cost of the trade is the difference between the VWAP of the executed order and the VWAP of the security in the market during its execution period. The same applies for positive and negative differences between both VWAPs and buy and sell orders.
|
Side comment |
|
When a broker receives a Care Order, he is faced with the quandary of whether to execute it as quickly as possible in the market or over a longer period of time. Both options have their pros and cons. If executed quickly, it is less likely that the security's price will "slip away" and that he will have to buy at a higher price or sell at a lower price (respectively for a buy and sell order). However, the trade will have more impact on the market if the ratio (security liquidity)/(order volume) is low. i.e. the broker will “sweep” various prices to exercise his order, thereby worsening the average price of the trade. If the broker decides to execute the order little by little, in batches with security volumes closer to the average execution volume for the security in question, the impact in the market will be minimal but he faces the risk that the price might move against him while all the batches are being executed. The best option is a combination of the above. If we were to use a graph to show the costs in basis points of the impact on the market depending on when the order is executed, the curve would be an asymptote converging at zero as the time increases. The biggest impact would occur if the order were executed all at once (time = 0). Also, the curve which reflects the costs in basis points of the market risk starts at zero for t=0 (the stock doesn't fluctuate if we don't give it time) and gradually steepens the longer we take to execute the order, and it also steepens as volatility rises. Putting these two curves together we get the optimum time for the security in question, which is the minimum of the curve, and which will depend on its volatility, the size of the order and the security's liquidity. Almgren developed the formula which defines the optimal t (alpha1 and alpha2 on the chart). |
All the broker's orders and trades can be fed into the TCA and grouped according to AT origin, destination broker, trader, etc. so as to estimate the costs at these levels. In order to calculate this, we need tick-by-tick databases which allow the system to compare executed trades with the prices in the market at any given time. If we want to extend this study to various different markets (MTFs), we also need historical intraday data for all of them. Given the sheer volume of data, dozens of TeraBytes and powerful servers are needed to process all the information.
Over the next few months, Visual Trader will launch a TCA service
Visual Trader's TCA will process all the daily trades of clients using the service and compare these with the executions on the whole market (including different venues) using statistical performance analyses such as VWAP or Implementation Shortfall (IS) and analyse all the various implicit transaction costs of these trades in depth.
The client will receive a daily report of their trades, broken down by market, account, trader, destination broker etc. This will allow them to determine, inter alia, which broker is offering them the best service and which traders on their desk are the most efficient.
These reports can be used to draw up an in-depth post-trade analysis of the client's trades: What was my trade? Did I buy/sell cheap or expensive? Why? Using this information, the entity can improve its operations by focusing on the highest implicit costs of all those measured by the system such as the spread, the market impact or the cost of SOR (Smart Order Routing).
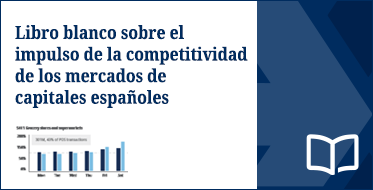
Example of a TCA result: the above chart compares all a broker's daily trades with the market VWAP. The chart (the ordinates axis represents the difference in bps compared to the VWAP (Y=0) while the abscissa axis represents successive sessions) shows that on average (blue line) the broker who is the object of analysis systematically buys and sells better than the market, saving their clients around 50 basis points. The shaded area represents the average deviation, showing the variation in his consistency (scant to great deviation) and that not all the trades outperformed the market.