
A new study has been published that focuses on the Spanish equity risk premium and the dividend payout ratio (DP ratio) for the last 120 years. The research, titled The Historical and Expected Equity Risk Premium in Spain: A Long–Run View, 1900–2020, was conducted by Stefano Battilossi, Stefan Houpt, and Miguel Artola, from Universidad Carlos III de Madrid.
In their report, the authors constructed a new historical index for the largest and most liquid companies (the H–IBEX), based on an original database and using the same methodology as the IBEX–35®.
One of the conclusions of the work is key for current investors: over the last century, the dividend–price ratio (DP ratio) has had predictive power regarding future equity returns and the equity risk premium.
This is not a surprising result, as numerous studies support the predictive power of this indicator for the stock markets of major industrialized economies. Nevertheless, the study on Spain is the first to confirm this finding in the case of a historically emerging market that has reached full maturity only in the last thirty years.
What Is the Dividend–Price Ratio?
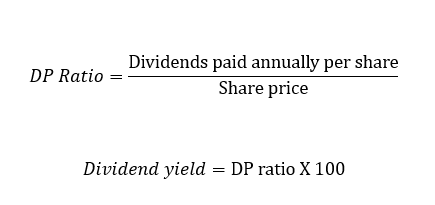
The dividend–price ratio is the relationship between dividends and the price of shares. In other words, it measures how much dividend is received in relation to the price paid for a share. Since the pioneering studies of John Campbell, Robert Shiller, Eugene Fama, and Kenneth French, dating back to the late 1980s, it has been the most widely used indicator in the academic finance literature, in macroanalysis, and in long–term quantitative valuation models, because it is more practical to work with ratios without converting them to percentages. It is a technical measure expressed as a decimal number and is used as an analytical variable, not as a direct signal for making investment decisions.
In market terms, the DP ratio is usually translated as dividend yield: it is the same dividends–to–price relationship, but expressed as an annual percentage to communicate directly the “return from dividends” of the investment. That is why it is the most common measure in the stock market environment, used by analysts, brokers, financial media, and investors.
Mathematically:
What Does This Mean in Practice?
When the DP ratio is high (prices depressed relative to dividends):
- The expected risk premium increases.
- Future returns tend to be higher.
When the DP ratio is low (expensive market):
- The expected risk premium decreases.
- Future returns tend to be lower.
Using the DP ratio in long–term studies brings to light what is the crucial empirical regularity: high prices relative to dividends have systematically preceded many years of low returns; conversely, low prices have preceded years of high returns.
Why Does the DP Ratio Matter?
The logic is simple but powerful. In standard valuation models, a stock’s price depends on expected dividends and the discount rate required by investors. That discount rate includes two components: the risk–free rate and the risk premium (the additional compensation for investing in equities).
The DP ratio is used as a valuation measure that captures how much dividend flow the investor receives for each euro paid and, therefore, is linked both to the volume of dividends and to the discount rate demanded by the market. Under the premise that when the required risk premium increases (because risk perception or risk aversion rises), the price tends to adjust downward relative to dividends, which raises the DP ratio; conversely, when the required premium falls, the price rises and the DP ratio decreases.
Based on the data, the study finds that, historically in Spain, when the DP ratio has been high, future returns have tended to be higher; thus, the DP ratio has statistically significant predictive power. That is, aggregate market valuation contains information about expected returns.
This predictive power is relevant both in–sample and out–of–sample.
“In–sample” means that the model is estimated and evaluated using the same set of historical data:
- Data from 1900–2020 are used.
- The relationship between DP and future returns is estimated.
- The extent to which DP explains return variation is evaluated.
The predictive power is robust both in the full sample and in the historical subsamples. This implies that historically, when the market was “cheap” – that is, with a high DP–future returns tended to be higher. When the market was “expensive” (low DP), future returns tended to be lower. This does not exclude the existence of periods in which this predictive power weakens or disappears, especially in the short term, owing to anomalous price behavior, such as in the case of the long stock market depressions of the 1970s and 1980s and the decade following the crisis from 2008 to 2010.
The classic problem is that a model can perform well “looking backward” simply because it has been fitted to historical data. That is why the study goes further and analyzes out–of–sample predictive power.
“Out–of–sample” means that the model is evaluated as if in real time, simulating what an investor could have done based on the information available up to that date and without knowledge of the future. The typical procedure is to:
- estimate the model up to a date T
- predict future returns
- move the period forward
- reestimate with more data
- repeat the process
Some models that work in–sample tend to fail out–of–sample. In the financial literature, numerous predictors lose power out of sample. The fact that the DP ratio works out–of–sample, as evidenced by the study, implies that it is not merely a retrospective statistical regularity but incorporates fundamental information that would have been useful in real time and has practical economic value.
For a market with more than a century of data, the message is clear: future returns are not completely unpredictable, and valuations matter. The DP ratio is a useful indicator for estimating expected returns over medium–term horizons (one to five years), with real predictive power over the expected risk premium that increases with the time horizon, making this metric a valuable tool for helping to form expectations about future returns.
Spain: A Market Where Dividends Matter
Another important point highlighted by the research is that in Spain, as in most European markets and in the US, until the last third of the twentieth century (when companies began to favor share buybacks to reward their shareholders), long–term returns have mainly come from dividends, not merely from share price appreciation; in fact, the IBEX–35 with dividends has accumulated an annual return four percentage points higher than the traditional index since its inception in 1992.
The IBEX–35 is breaking dividend records, and the market expects them to increase by around 31% between 2024 and 2026. In parallel, various analyses highlight that investing in companies with high shareholder remuneration has served as a “shield” against volatility.
Therefore, dividend records are not only good short–term news; in the Spanish market, shareholder cash flow is the core of returns, not merely a complement. It is also a key component in understanding future performance. In a market where dividends explain much of the historical return, monitoring the dividend–price ratio is more than a statistical curiosity: it is a tool for estimating what the stock market may offer in the coming years.
In Spain, long–term returns have mainly come from dividends. The IBEX 35 Total Return is the IBEX 35 version that reinvests the gross dividends distributed by its constituent companies, providing a more comprehensive measure of the actual return earned by investors.